Recycle Digital Twin: a practical way to manage operations, lift throughput, and improve safety
If you run a recycling operation, whether it be metals, MRFs, C&D, e-waste, paper or organics, your day rarely goes to plan. Feedstock quality shifts. Constraints emerge and move. Safety can hinge on one decision in one busy corner of the plant. It’s not that you lack expertise or data. You lack a single, shared picture of how the entire system from suppliers to products is performing, so you can make the right decisions, quickly.
This post lays out a straightforward approach for leaders in recycling: how a Recycle Digital Twin turns siloed production, maintenance and safety signals into a common operating picture your teams can rely on shift to shift.
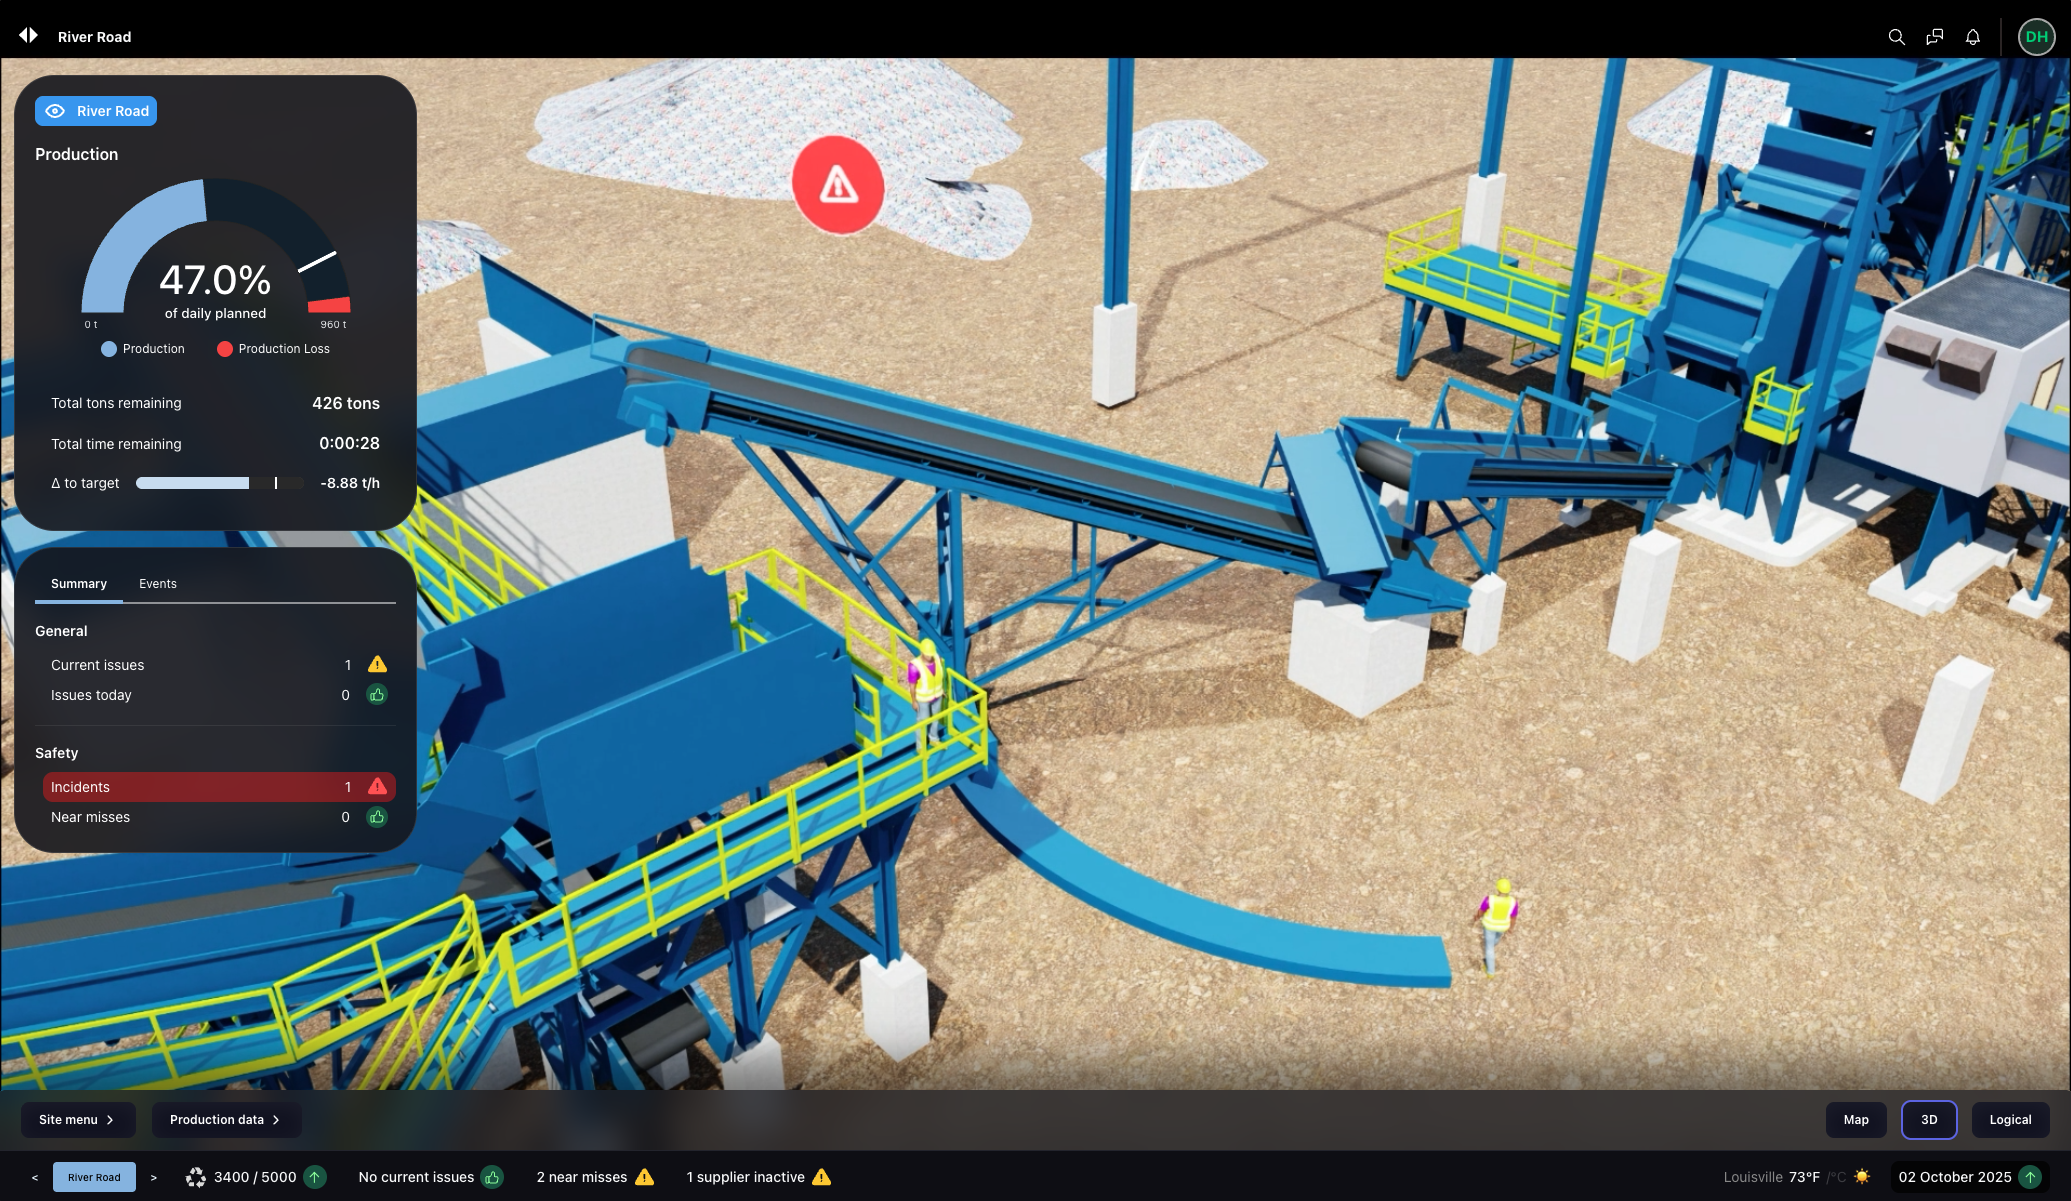
Recycle Digital Twin - 3D Explore view with real time Asset and Safety alerts, and near real time Operator simulation which enables dynamic geofencing
What a Recycle Digital Twin actually is
A Recycle Digital Twin is a living, contextual model of your supply chains and operations that fuses production, maintenance and safety data so frontline leaders can see where flow is stalling, why, and what to do next. In practice, the twin organizes your operation through five lenses your teams already care about:
Portfolio: compare sites and lines, rank losses and target attention on what moves the needle.
Value Chain: the end-to-end view of how material moves, so you can spot the queues, waits and clashes you miss when you stare at one unit KPI, and can make production decisions now that will mitigate losses and improve throughput.
Explore 3D: a visual model that puts events in physical context and gives crews a shared reference that’s easier to use during huddles and troubleshooting.
Safety: persistent supervision and structured near-miss capture connected to the operating picture, not left in forms or inboxes, and providing users with the ability to take action immediately.
Asset: a single place to pull every record for a critical asset when diagnosing issues, planning a shut or creating new work orders with a single click.
These lenses are deliberately matter-of-fact. The value is that they help supervisors, maintainers and safety leads work off the same picture of the most important issues, rather than hunting across five systems and locally stored spreadsheets to then have 3 phone calls.
If you follow our work, you’ll recognise the emphasis on situation awareness, constraints and action. The Recycle twin situates users with what’s happening right now, regardless of where they’re sitting and what they can see with their own eyes. The Recycle twin threads raw data through logical models and AI, to bring the critical production constraints to light in seconds, and forecasts what impact current issues will likely have on production in the future. The Recycle twin provides and suggests actions that users can take right now, without needing to cross into other systems, but also provides that bridge to dive into detailed systems of record when required to ensure that changes are captured correctly and quickly. Half the battle with time poor and disconnected workers is friction; we need to make it easy to take action quickly on the right things at the right time.
Day-one problems the twin tackles
1) The real constraint is invisible
Under-delivery tempts you to push CAPEX at the biggest machine or to add more mobile plant or to create ever bigger stockpiles. In reality, the constraint moves constantly, but predictably, once you can see the truth; infeed volatility this morning, sorter reject spikes this afternoon, baler dwell time on Saturday. The twin keeps a running ledger of where material is queuing and why, so you focus on the constraint that is costing you throughput now, not last quarter.
2) You can’t tell which losses are worth fixing
There are hundreds of small losses and a handful that move the needle. The twin converts those losses into an annualized view so you can see which changes actually shift throughput, yield and rework, and which are noise.
3) Production and maintenance argue with different facts
Production speaks in TPH, recovery, and contamination. Maintenance speaks in MTBF, MTTR, and direct labor costs. The twin threads events across both, showing causal chains: which stoppages drive production loss, which are nuisances, and where hand-offs or work windows would have reduced production hits. Collaboration requires shared language and shared context.
4) Safety learning gets trapped in forms
Near misses and notifiable incidents generate paperwork but don’t stick as shared learning. OSHA-aligned guidance and national safety bodies consistently treat near-miss reporting as a leading indicator that, when paired with visible follow-through, reduces recurrence and strengthens safety culture. A twin makes this practical by capturing near misses in a structured way and replaying them in the operating context so crews can see what happened, where, and how to change the setup or behaviour to avoid a repeat.
5) Leaders lack one current and common picture
The same model powers shift huddles, daily reviews, and monthly performance, without slide-ware and spreadsheets. When everyone sees the same facts, in the same order, and sees them every day/week/month, then a shared understanding of what is happening and why, and what we need to do to fix it, grows and flourishes. Teams need a scoreboard, and individuals need to be able to dive into their own domain’s details. Both are needed.
How it works: simple plumbing, usable context
A twin doesn’t need every point and pixel you’ve ever captured. It needs just enough of the right data to make better decisions at the cadence you actually work.
Typical data sources for a recycling facility are:
Production: PLC tags, SCADA summaries, weighbridge outputs, optical sorter counts, baler cycles, line speed, downtime codes.
Quality: contamination checks, sorter rejects, bale audit samples.
Maintenance: CMMS work orders, failure codes, spares, planned versus actual shut windows.
Safety: near-miss and incident logs and permits.
Commercial: grades and revenues to convert changes and constraints to value leakage.
Start with one line and two to three sources. The twin synchronizes time across systems, maps assets and areas into a simple hierarchy, and builds a living ledger of losses and constraints up and down the value chain. From there, you agree as a team where to intervene first, and start building the structured playbook.
Rule of thumb: if a signal won’t change a decision at your operating cadence, don’t integrate it yet.
Where critical data is missing on sites, we suggest or procure the required hardware, plumb it into the twin, and show you how this new data opens up insights into previously dark areas. For safety, we bring 3rd party trusted AI vendors whose models take safety and security camera data and transform it into structured insights. Those insights, and the raw data feeds, flow through the twin and to the user. Where more cameras, or LIDAR, is needed to provide coverage and accuracy, we recommend and supply and plumb that as well.
Rule of thumb: only connect or acquire new data where there is a clear use case and value proposition.
Where data is available externally, such as supplier transit data (when a truck leaves, where it is, what route it’s taking, and therefore what the ETA is), we integrate that data, or suggest how to push that requirement at suppliers, in order to bring the value chain visibility into the twin.
Rule of thumb: think beyond the site fence. Improved supplier data can save (and make) you millions, and sometimes it’s better to invest directly today to make 10x more tomorrow.
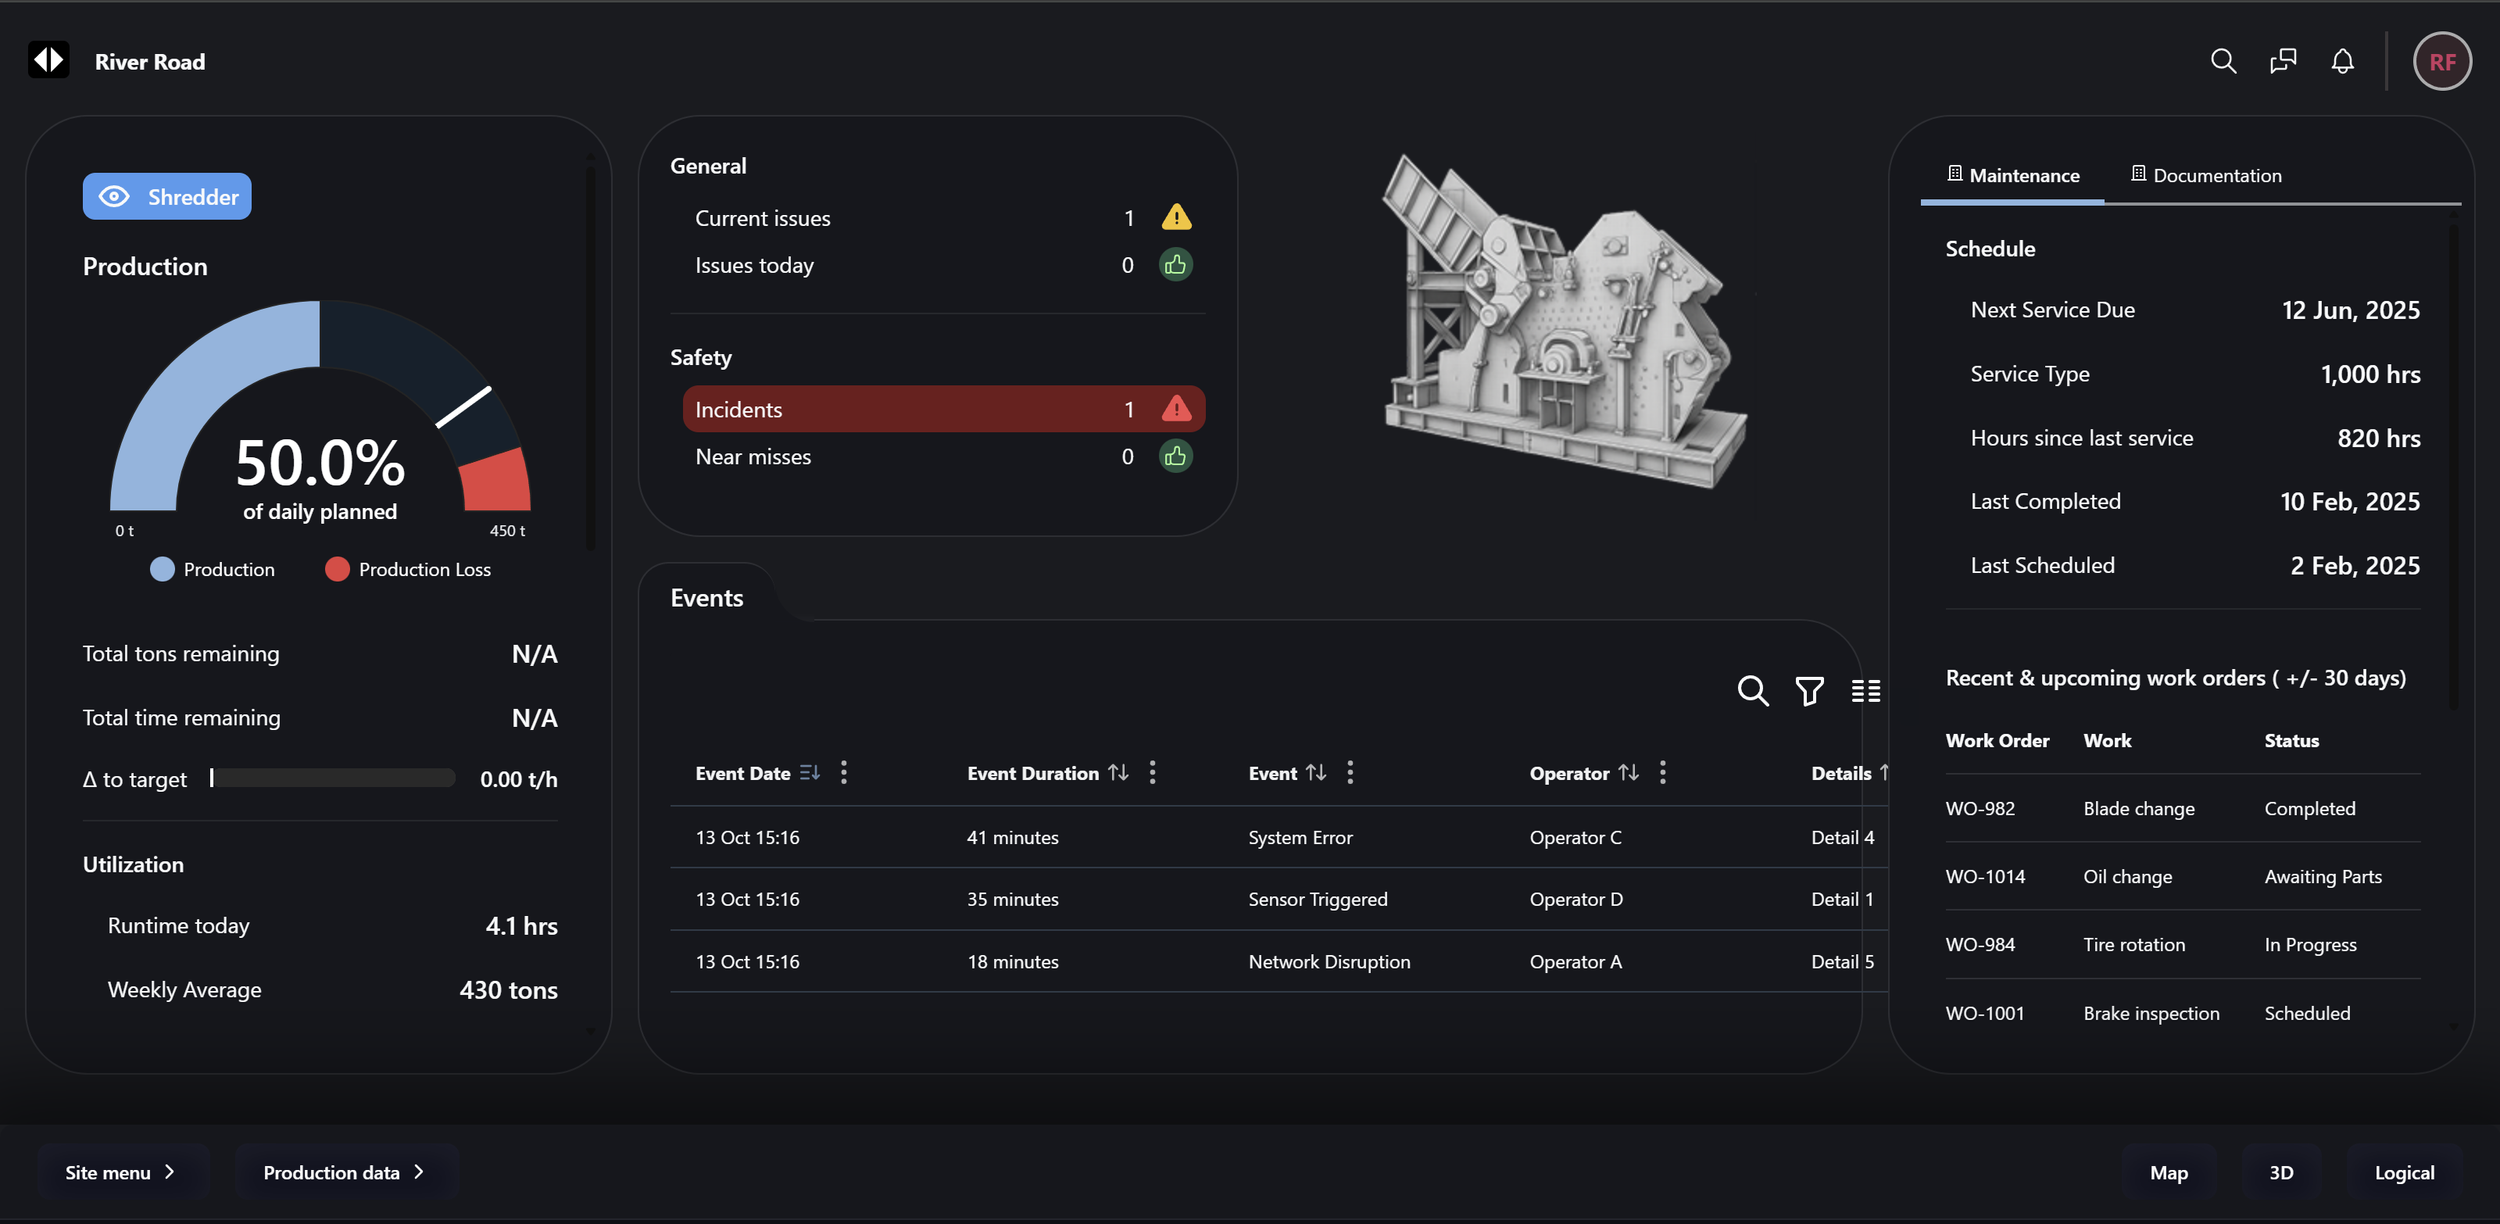
Asset view - fuse equipment and system operational, maintenance and static data and view events through the lens of downtime, not just alerts
Safety: make near misses visible and useful
Top performers treat near misses as gold. OSHA-aligned templates emphasise that near-miss reporting is proactive monitoring; it surfaces undiscovered hazards and negative trends before harm occurs. National Safety Council guidance pushes the same point: define near misses clearly, run a non-punitive system, and close the loop by investigating root causes and sharing improvements. A twin gives those steps a shared home so people actually act on them.
Computer vision is increasingly used to detect risky interactions and near misses that never hit a log, which is very useful in high-traffic yards, tip floors and loading zones. The lesson from U.S. transportation safety research is transferable: analytics that detect conflicts and near misses provide a proactive way to target controls before someone is harmed. The key is not the AI itself, it’s wiring those signals into your operating picture so actions get taken, tracked and reviewed. Combining real-time sensing, prediction and decision support in a single operational model, with 3D simulation to paint the picture without any words, is exactly what you want in a plant setting.
At the executive level, injury and fatality statistics remain a sober reminder to keep leading indicators front and centre. The twin surfaces near misses in context, and the 3D playbacks at huddles and weekly meetings strengthens controls and improve results without waiting for the next quarterly report or email from the CEO.
Read more about our approach to Safety here.
Throughput: lift flow by focusing on the real constraint
Throughput gains in recycling look like any other asset-intensive environment: fix the real constraints, avoid starving and blocking events, react quickly and effectively to issues, and synchronize planned work with production reality. A constraints-aware twin drives these behaviors:
Identify the global constraint on today’s shift - the thing limiting output right now.
Exploit it and keep it fed and never blocked. Work upstream to find new feed, or change feeds, or produce different products.
Subordinate everything else. Pace non-critical areas to support the constraint, change maintenance windows to match future supply shortages.
Elevate the constraint only once you’ve proven you can consistently use it fully, and elevate it intelligently. Don’t throw money at the biggest machine if the constraint is an undersized bin, or a tramp magnet that consistently blocks.
Repeat the cycle, because constraints move, and suppliers change, and feedstock varies, and no day is really an “average day”.
There’s no magic here. Just the discipline of Theory Of Constraints, encoded in software so you don’t need to run a study every time something changes.
Read more about how we apply Theory of Constraints here.
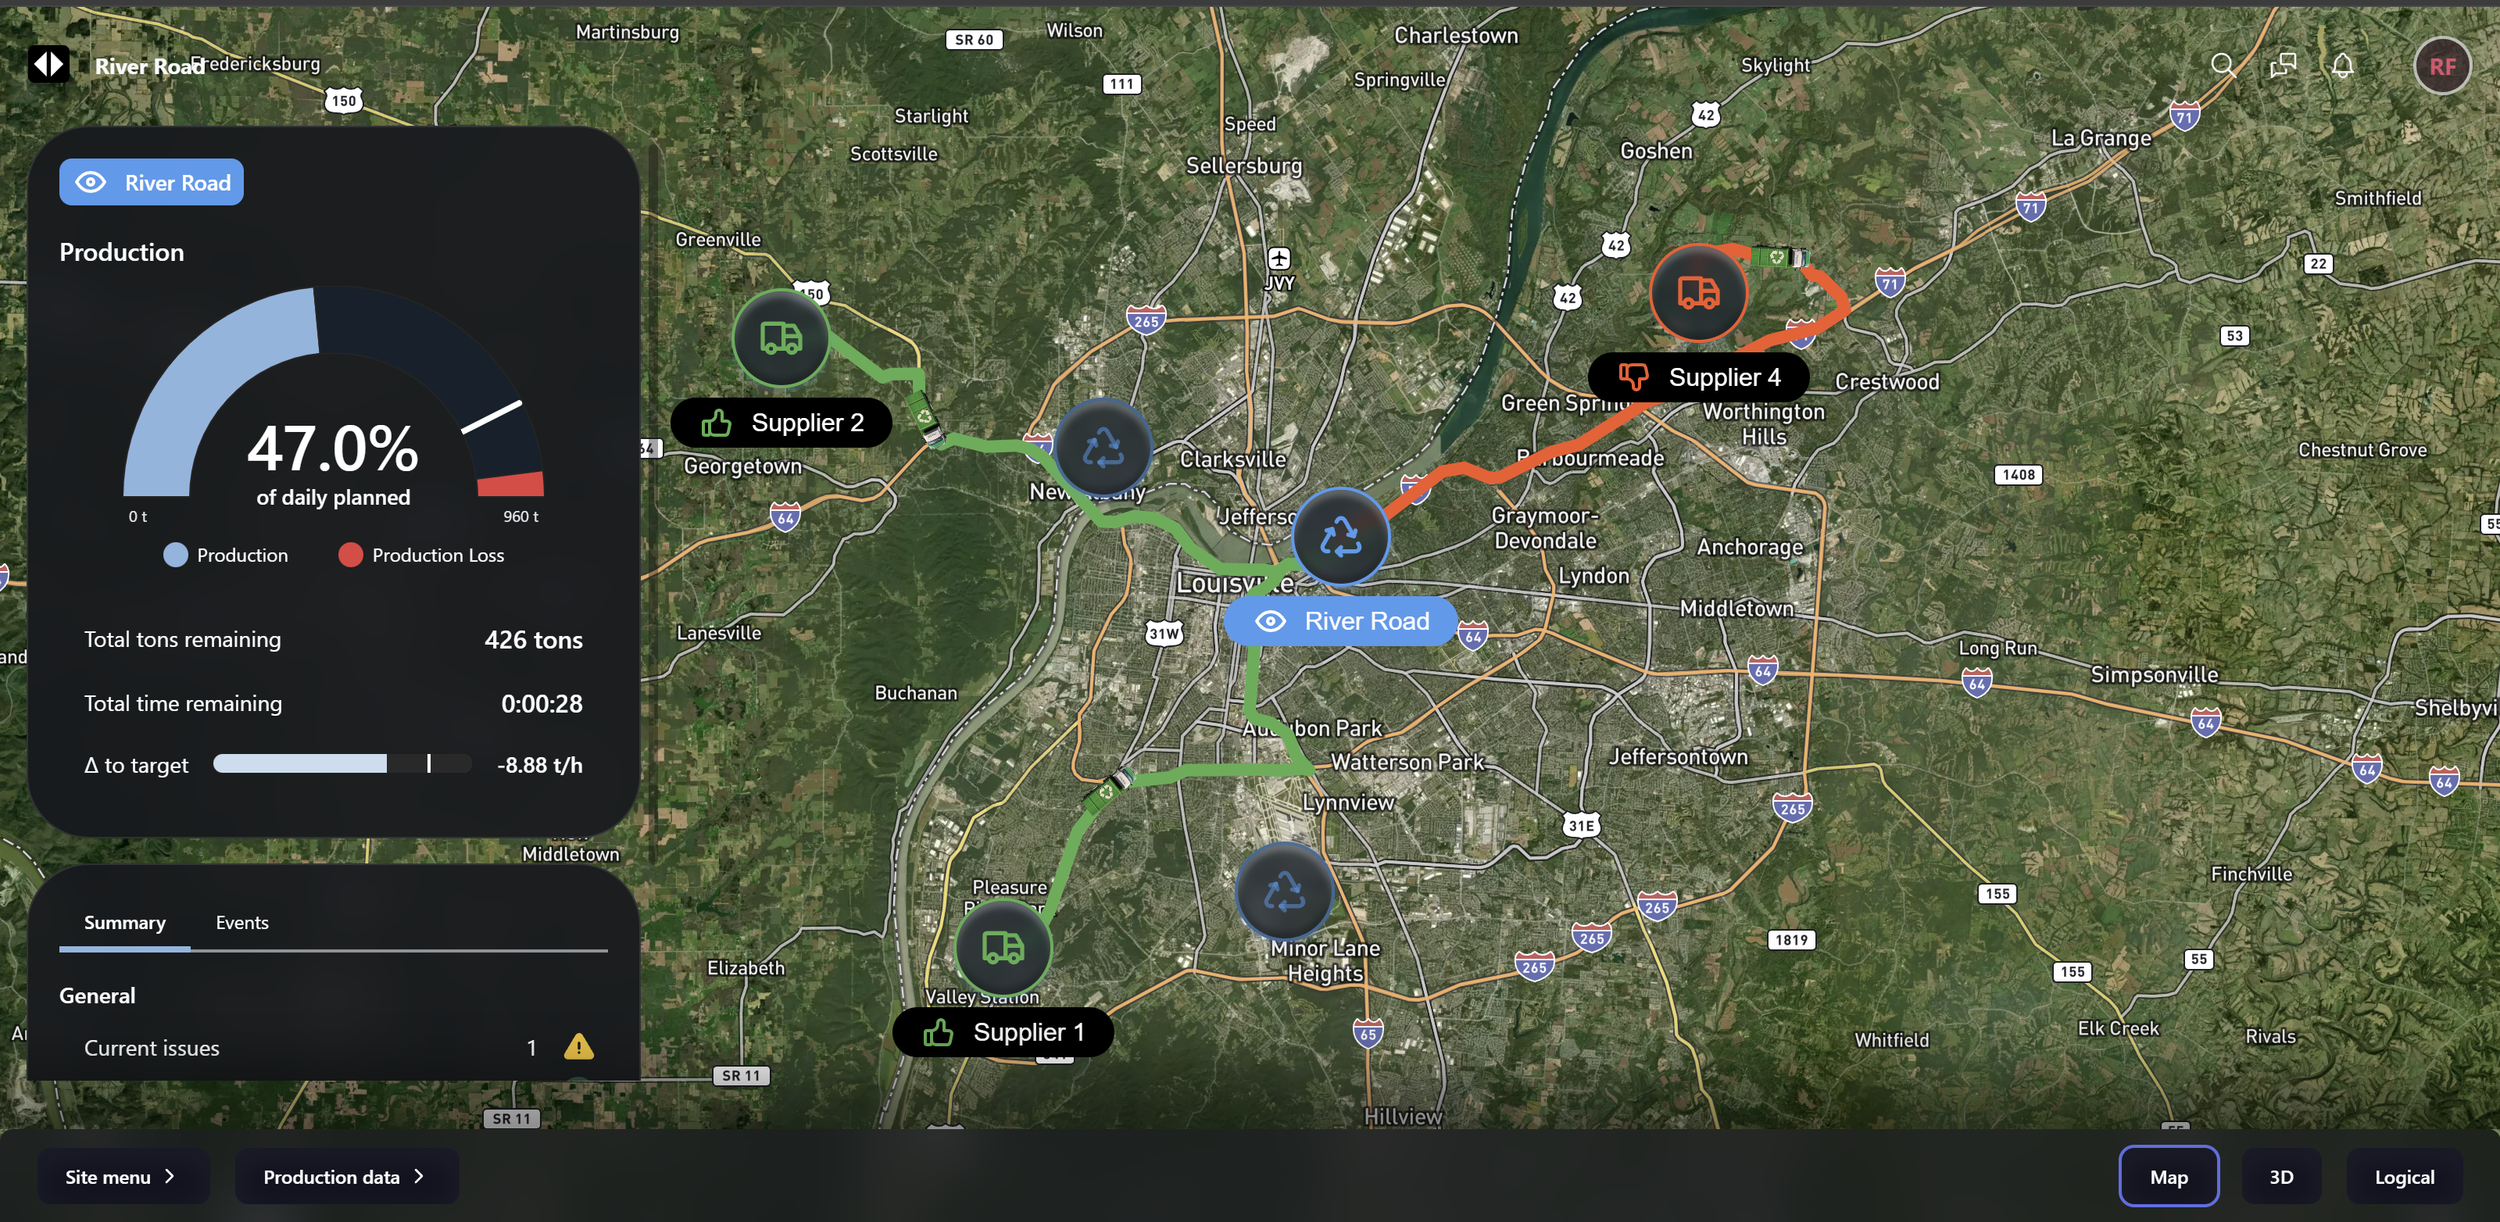
Value Chain view - look across your value chains, from supply to processing, to identify current bottlenecks and forecast future bottlenecks
A day in the life, from morning huddle to night shift
06:30 — Morning huddle opens with the Portfolio view. Yesterday’s top three losses across all sites: upstream infeed variability that starved the primary sorter, a planned conveyor inspection that overran into shift change, and a contamination spike mid-afternoon.
06:35 — In Value Chain, the shift sees where queues formed and where a downstream idle created backflow. The team notes that already there’s an early morning delivery flagged as delayed, and pulls forward a quick change to infeed scheduling and adds a cleaning micro-stop when reject rates breach a threshold.
12:37 — Explore 3D shows a short baler stoppage. The supervisor threads it back to a picker redeployment that starved the upstream zone and coordinates a two-minute tweak to prevent a repeat. No need for a new work order, but the downtime is captured automatically in Value Chain and Asset.
13:00 — Explore 3D flags a near miss that was captured on camera and happened only 2 min ago. A quick call to the loader operator informs her of what happened and where, and the near miss is pushed to the plant supervisor and he acknowledges it.
13:06 — A call comes in from Group, flagging that near miss that they also saw. Pointing them to the supervisor ack, they are happy that it’s captured and something has been done about it. The Group Safety Mgr mentions he’s seen 5 today from other sites.
13:14 — Explore 3D shows that while you were on the phone, there have been 3 temp alerts on the in-feed conveyor. None were high enough to trigger a stop, but a quick click through to Asset shows that this conveyor had 7 of the same alerts in the last 3 days, none of which were high enough to warrant action. Time to flag this, so a click creates an inspection work order that goes from Asset to the CMMS, and an email is generated and sent to the plant supervisor and maintenance lead with a link to Asset, so they can dive into the details when it suits them.
14:30 — Asset view is used to pull recent production losses and alarm history for the suspect conveyor. Maintenance approves the inspection via the CMMS,to be done in a low-risk supply window the next day to avoid starving the constraint at this site, which is the shredder.
16:00 — Shift ends with an updated constraints and production view in Value Chain. The team talks about how things went, and the board shows them things that happened that they didn’t even know about. The plant supervisor replays the near miss in Explore 3D and the team agrees a small layout change for the weekend, due to a stockpile that has crept over the bund and is likely to keep growing. The supervisor points out the new work order for tomorrow that was just created, and shows how the conveyor has had a few high temps now. One of the operators mentions he has heard a funny whine from it a few times recently, but thought nothing of it. The supervisor makes a quick note in Asset for that work order, which is automatically pushed into the CMMS for maintenance.
There’s nothing flashy here, just shared models that keep the facts in order and make the next right actions obvious. We don’t want flashy - we want accurate, usable and persistent.
Getting started: 12-week proof of value
A twin should earn its keep quickly.
Weeks 0–6: Connect and baseline
Pick one line and two or three data sources. Map the asset hierarchy, align time and baseline TPH, availability, recovery, contamination. Connect data, create the constraints model, plug the machine vision AI into camera feeds, spin up the twin and get the supervisors into it to show them how it works and what they are going to see.
Weeks 6 - 10: Make it usable
Stand up Value Chain and Explore 3D in operational routines. Run cycles of morning huddles and shift reviews using the twin. Capture the top three constraints with dollar-impact estimates. Capture the areas people aren’t familar with, and run training and education on constraints, near misses and rescheduling work.
Weeks 10-12: Prove a change
Choose one operational tweak and one maintenance change, for example, a revised micro-stop regime plus a standardised changeover procedure. Measure impact in the twin.
Week 12+: Scale sensibly
Replay before and after. If you’ve unlocked a 10-15 percent TPH gain, a double-digit downtime reduction or a measurable safety benefit, the case to roll to other lines or sites writes itself. If there are data gaps that need closing, write the business case and use the twin to show exactly where the dark spots are, and the difference between connected and siloed. Scale based on value and risks mitigated.
FAQs
Do we need every system integrated before we start?
No. If a signal won’t change a decision at the cadence you work, leave it out for now.
We already have dashboards - why this?
Dashboards are essential, but they’re not the operating picture. A twin shows flow, where it stalls, and ties production, maintenance and safety into one context so you can prioritise and test changes, not just report.
We are bringing predictive maintenance in - why do this instead?
The Recycle twin doesn’t replace advanced tools, it enhances them. Predictive maintenance has proven it’s worth in many industries, but it has also proven to be very difficult to reconcile with production. Lower direct maintenance costs rarely offset production losses from rapid and unpredictable changes to routines, or repeated rework to non-broken equipment during peak production periods. Predictive maintenance requires good planned maintenance practices and effective reactive maintenance, all in concert with production and supply chain realities. Connect your predictive tools to the twin, just like your CMMS, and then use the twin to help prioritize all work activities, regardless of source or type, and bring maintenance and production collaboration into the foreground.
Where does near-miss reporting fit?
Use OSHA-aligned definitions and run a non-punitive system. The National Safety Council stresses investigation and feedback so learning sticks. The twin binds those elements into a shared operating picture so crews see — and act on — the same facts.
We already have our own safety machine vision AI tools, do we need yours too?
No! Keep your great tools and we’ll just plumb them into the twin. If they deliver the benefits neede,,d great, if not, we’ll recommend some others, or addtional coverage, or on-prem hardware to reduce latency, or whatever is needed. All we want is fast, strong safety signals in context of the physical assets. We’re not at all fussed how we get you there.
Is this only for big networks?
No. Single-site operators often see the fastest gains because the twin makes scarce leadership time go further. Multi-site groups use the Portfolio view to compare like-for-like and focus capital and coaching where it counts.
We already have high fidelity scans of our plant, do you need to scan it again?
Maybe yes, maybe no. Many sites have old scans that are somewhat ok. We work with reality capture experts globally to acquire new data as required. In the US, our partners Spartan Scanning Solutions are the go to crew for very high resolution, super accurate scans of the most complex industrial sites.
Will customers or auditors care?
A clearer operating picture helps evidence control, continuous improvement and quality, which are all useful in customer audits and for regulator engagement. Regulators are increasingly moving to model based assurance across major infrastructure projects, and investors will follow this trend. Differentiation to both customers and investors is made easy when you can plug them into what’s happening right now, anywhere in the world, and demonstrate a history of identifying and mitigating risks.
Why would suppliers give us access to data?
Supply chain visibility is a new concept to many players. The benefits to operators are an increased ability to manage and react to changes. For suppliers, the benefits come from differentiation and more sticky customers. When you as the operator can consistently see and manage change better, you may find that you’re making more money from higher priced but more visible suppliers; this is the antidote to the race to the bottom so many local networks find themselves in.
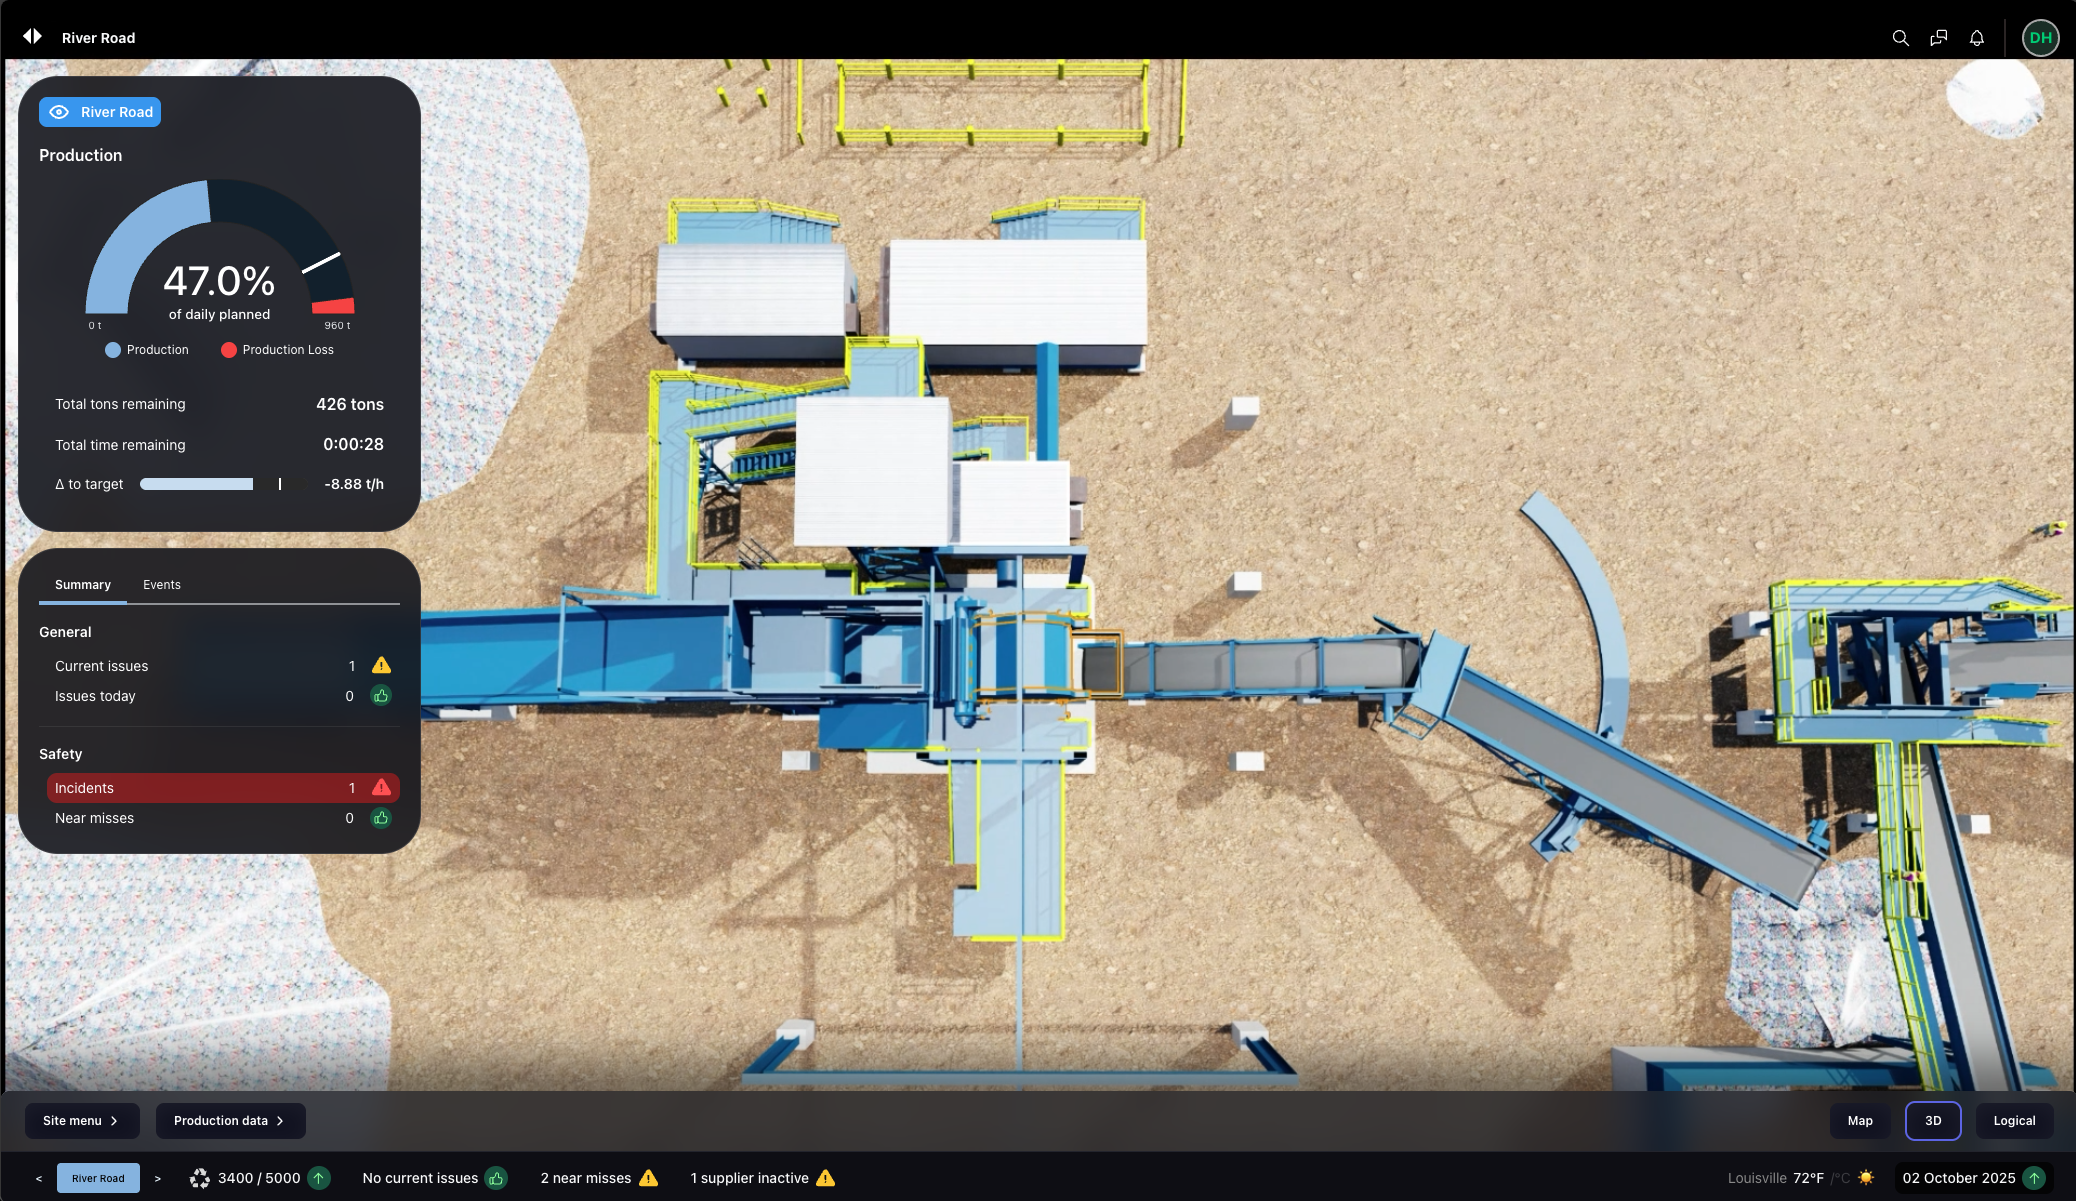
Explore 3D - view your Site in real time, including stockpile animations powered by AI models, fed by cameras. See where vehicles are located, where people are moving, and where equipment is operating.
Closing thoughts
Recycling, like many production industries, is a flow problem wrapped in a people problem wrapped in a fast changing supply chain problem. When your teams can see the same picture - where materials are and where they wait, where assets stumble, where behaviours are risky - they make better decisions to improve flow across the chain (not just at a single asset). A Recycle Digital Twin doesn’t promise magic. It makes the work visible and the improvements durable. That’s enough to lift throughput, reduce incidents, and give your crews the confidence to make tomorrow even better.
Reach out to learn more. We deliver use case specific Site Twins for Recycling, Mining & Manufacturing that improve throughput, lower downtime and enhance safety.